Quant-Arena:Benchmarking LLM Agents for Quantitative Trading Research
Can a language model research a trading strategy, commit to it, and have it hold up on a year it has never seen?
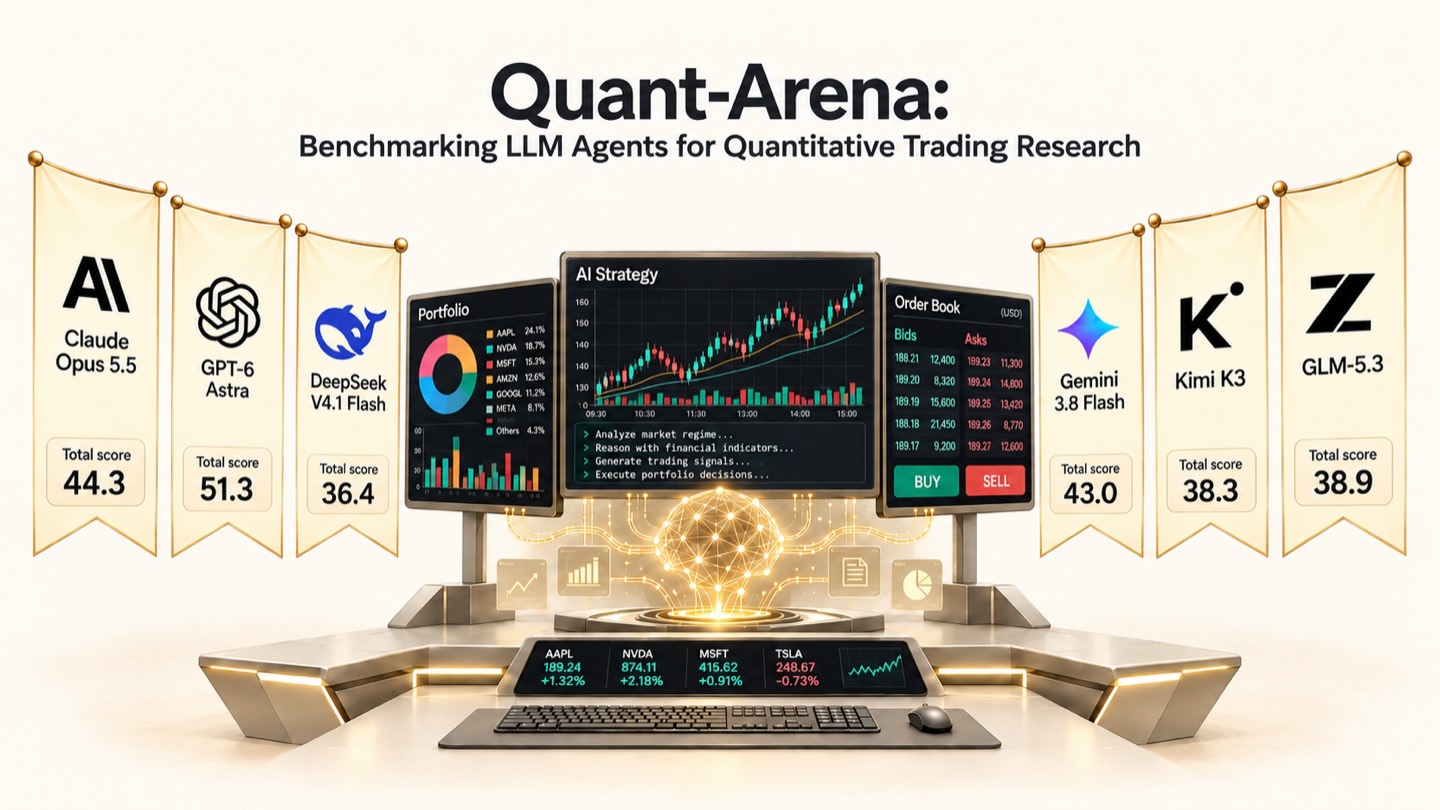
The task
Each model acts as a quantitative researcher. It researches on 2022–2023 with bounded feedback, commits one strategy, and is assessed once on a sealed 2024 window in a cash account. The score combines the research-window result (Sin) with the sealed 2024 result (Sout), weighted toward the out-of-sample year.
- 01 Research
The model studies 2022–2023 data and receives bounded feedback on the candidates it submits.
- 02 Commit
It commits exactly one strategy. Nothing can be changed after this point.
- 03 Sealed assessment
The committed strategy is assessed once on a sealed 2024 window, trading in a cash account.
Iterative research
The model researches on 2022–2023 with bounded feedback on its candidates, then commits one strategy.
One-shot generation
The model writes one strategy in a single pass, without research-window feedback.
Key findings
No model beats the market
In the sealed 2024 test year, the equal-weight market returned 17.1%. No model's best strategy kept pace: the strongest gained 10.7%, and 5 of the 9 models lost money.
Ranking skill does not reach the portfolio
Most models rank stocks better than chance, yet the stocks they rank highest, the ones the portfolio actually buys, earn less than those ranked just below. Average rank correlation says little about whether a strategy makes money.
Some models learn to time the market
After research feedback showed losses, the top-scoring model wrote a market-timing rule: hold cash whenever the market trends down. It sat out the February 2024 crash, with a drawdown of −1.7% against −29.6% for the market. Because it also missed much of the rebound, it still finished behind the market for the year.
Leaderboard
Each model at its best-scoring configuration in each setting. The 2024 columns describe the committed iterative strategy on the sealed year. The full leaderboard lists every configuration.
| # | Model | Iterative | One-shot | 2024 ARR | Excess (pp) | Sharpe | MDD |
|---|---|---|---|---|---|---|---|
| 1 | GPT-6 Astra | 51.29 | 35.22 | 10.7% | −6.3 | 0.86 | −6.8% |
| 2 | GPT-6 Sol | 51.14 | 32.15 | 8.6% | −8.4 | 1.89 | −2.8% |
| 3 | GPT-5.6 Terra | 47.58 | 42.14 | 8.4% | −8.7 | 0.42 | −28.8% |
| 4 | Claude Opus 5.5 | 44.28 | 42.61 | 4.4% | −12.7 | 0.29 | −32.7% |
| 5 | Gemini 3.8 Flash | 43.04 | 35.91 | −2.9% | −19.9 | 0.06 | −33.9% |
| 6 | Claude Sonnet 5.5 | 40.93 | 40.24 | −12.2% | −29.2 | −0.23 | −36.1% |
| 7 | GLM-5.3 | 38.91 | 38.02 | −7.8% | −24.9 | −0.18 | −27.8% |
| 8 | Kimi K3 | 38.31 | 32.01 | −8.5% | −25.6 | −0.10 | −36.4% |
| 9 | DeepSeek V4.1 Flash | 36.45 | 29.92 | −5.7% | −22.7 | −0.06 | −30.3% |
| — | Kepler-1 Einsia AI | 77.56 | 94.0% | +76.9 | 2.98 | −15.9% | |
The equal-weight market returned 17.1% in 2024. Kepler-1 is a proprietary strategy developed by Einsia AI; its construction is not disclosed.
Inside the strategies
Three views of the strategy each model committed at its best-scoring iterative configuration, all on the sealed 2024 window.
Net asset value through 2024, starting from 1. No model beats the equal-weight market (dashed), and only four finish above their starting capital. GPT-6 Astra's flat start comes from its market-timing rule: it holds cash through the early-2024 decline.
Mean return of the following period, in basis points, for stocks in each signal decile (1 = lowest signal, 10 = highest; the peak and the top decile are highlighted). For most models returns peak in the second or third decile and fall toward the top decile, where the portfolio buys, so a higher RankIC does not translate into portfolio return. GPT-6 Astra and GPT-5.6 Terra rise across deciles, and GPT-6 Sol is roughly flat.
| Model | Size | Value (B/P) | Value (E/P) | Momentum | Volatility | Turnover |
|---|---|---|---|---|---|---|
| GPT-6 Astra | −0.62 | +0.96 | +0.11 | −0.24 | −1.05 | −0.74 |
| GPT-6 Sol | −0.63 | +0.65 | −1.00 | −0.48 | −0.29 | −0.46 |
| GPT-5.6 Terra | −0.11 | +0.05 | −0.10 | −0.06 | −0.04 | −0.08 |
| Claude Opus 5.5 | −0.10 | −0.24 | −0.43 | +0.01 | +0.54 | +0.56 |
| Gemini 3.8 Flash | −0.60 | +0.54 | +0.03 | −0.21 | −0.52 | −0.48 |
| Claude Sonnet 5.5 | −0.50 | +0.54 | −0.17 | −0.21 | −0.64 | −0.61 |
| GLM-5.3 | −0.15 | +0.49 | +0.16 | −0.10 | −0.63 | −0.47 |
| Kimi K3 | −0.85 | +0.10 | −0.52 | −0.38 | −0.07 | −0.35 |
| DeepSeek V4.1 Flash | +0.12 | −0.37 | −0.11 | +0.13 | +0.46 | +0.57 |
Average standardised style exposure of each strategy's holdings, where 0 is the market. Most models tilt toward small caps, high book-to-price (B/P) and low volatility; Claude Opus 5.5 and DeepSeek V4.1 Flash lean toward higher volatility and turnover, and GPT-5.6 Terra stays close to the market on every style.