Overall Leaderboard
Across 47 engineering tasks, the headline score is average rank (lower is better). On each task, models are sorted by best feasible score and given a rank; average rank is the mean of those ranks across all tasks — comparing models without mixing incompatible units. We also report the peer-relative Medal Score, which credits a model only for reaching each task's gold/silver/bronze podium.
Frontier Models
Frontier AI models evaluated directly on engineering problems — no extra search frameworks, just raw model capability.
Medal score
On each task, the three best scores in the v1 snapshot (2026-04-14) are frozen as gold / silver / bronze baselines; a model scores 1.00 / 0.67 / 0.33 for reaching each, then averaged over the task set (normalized to [0, 1]). It rewards only reaching each task's frontier and ignores negligible long-tail margins. We report it on both the full v1 set (47 tasks) and the v1-lite subset (10 tasks).
v1 · 47 tasks
| # | Model | Medal | 🥇 | 🥈 | 🥉 |
|---|---|---|---|---|---|
| 1 | GPT-5.4 | 0.596 | 24 | 5 | 2 |
| 2 | Claude Opus 4.6 | 0.490 | 9 | 18 | 6 |
| 3 | GLM-5 | 0.312 | 4 | 10 | 12 |
| 4 | DeepSeek V3.2 | 0.248 | 3 | 9 | 8 |
| 5 | Gemini 3.1 Pro Preview | 0.213 | 3 | 6 | 9 |
| 6 | Seed 2.0 Pro | 0.185 | 3 | 7 | 3 |
| 7 | Grok 4.20 | 0.184 | 3 | 6 | 5 |
| 8 | Qwen3 Coder Next | 0.121 | 3 | 3 | 2 |
v1-lite · 10 tasks
| # | Model | Medal | 🥇 | 🥈 | 🥉 |
|---|---|---|---|---|---|
| 1 | GPT-5.4 | 0.667 | 6 | 1 | 0 |
| 2 | Claude Opus 4.6 | 0.501 | 2 | 4 | 1 |
| 3 | GLM-5 | 0.233 | 0 | 2 | 3 |
| 4 | Gemini 3.1 Pro Preview | 0.200 | 0 | 2 | 2 |
| 5 | DeepSeek V3.2 | 0.166 | 0 | 1 | 3 |
| 6 | Grok 4.20 | 0.133 | 1 | 0 | 1 |
| 7 | Seed 2.0 Pro | 0.100 | 1 | 0 | 0 |
| 8 | Qwen3 Coder Next | 0.000 | 0 | 0 | 0 |
Average rank
Mean within-task rank over all 47 tasks (lower is better), across the paper's nine models.
| # | Model | Avg. rank |
|---|---|---|
| 1 | GPT-5.4 | 3.54 |
| 2 | Claude Opus 4.6 | 3.63 |
| 3 | GLM-5 | 4.34 |
| 4 | DeepSeek V3.2 | 4.76 |
| 5 | gpt-oss-120b | 4.81 |
| 6 | Gemini 3.1 Pro Preview | 5.53 |
| 7 | Grok 4.20 | 5.82 |
| 8 | Seed 2.0 Pro | 5.86 |
| 9 | Qwen3 Coder Next | 6.71 |
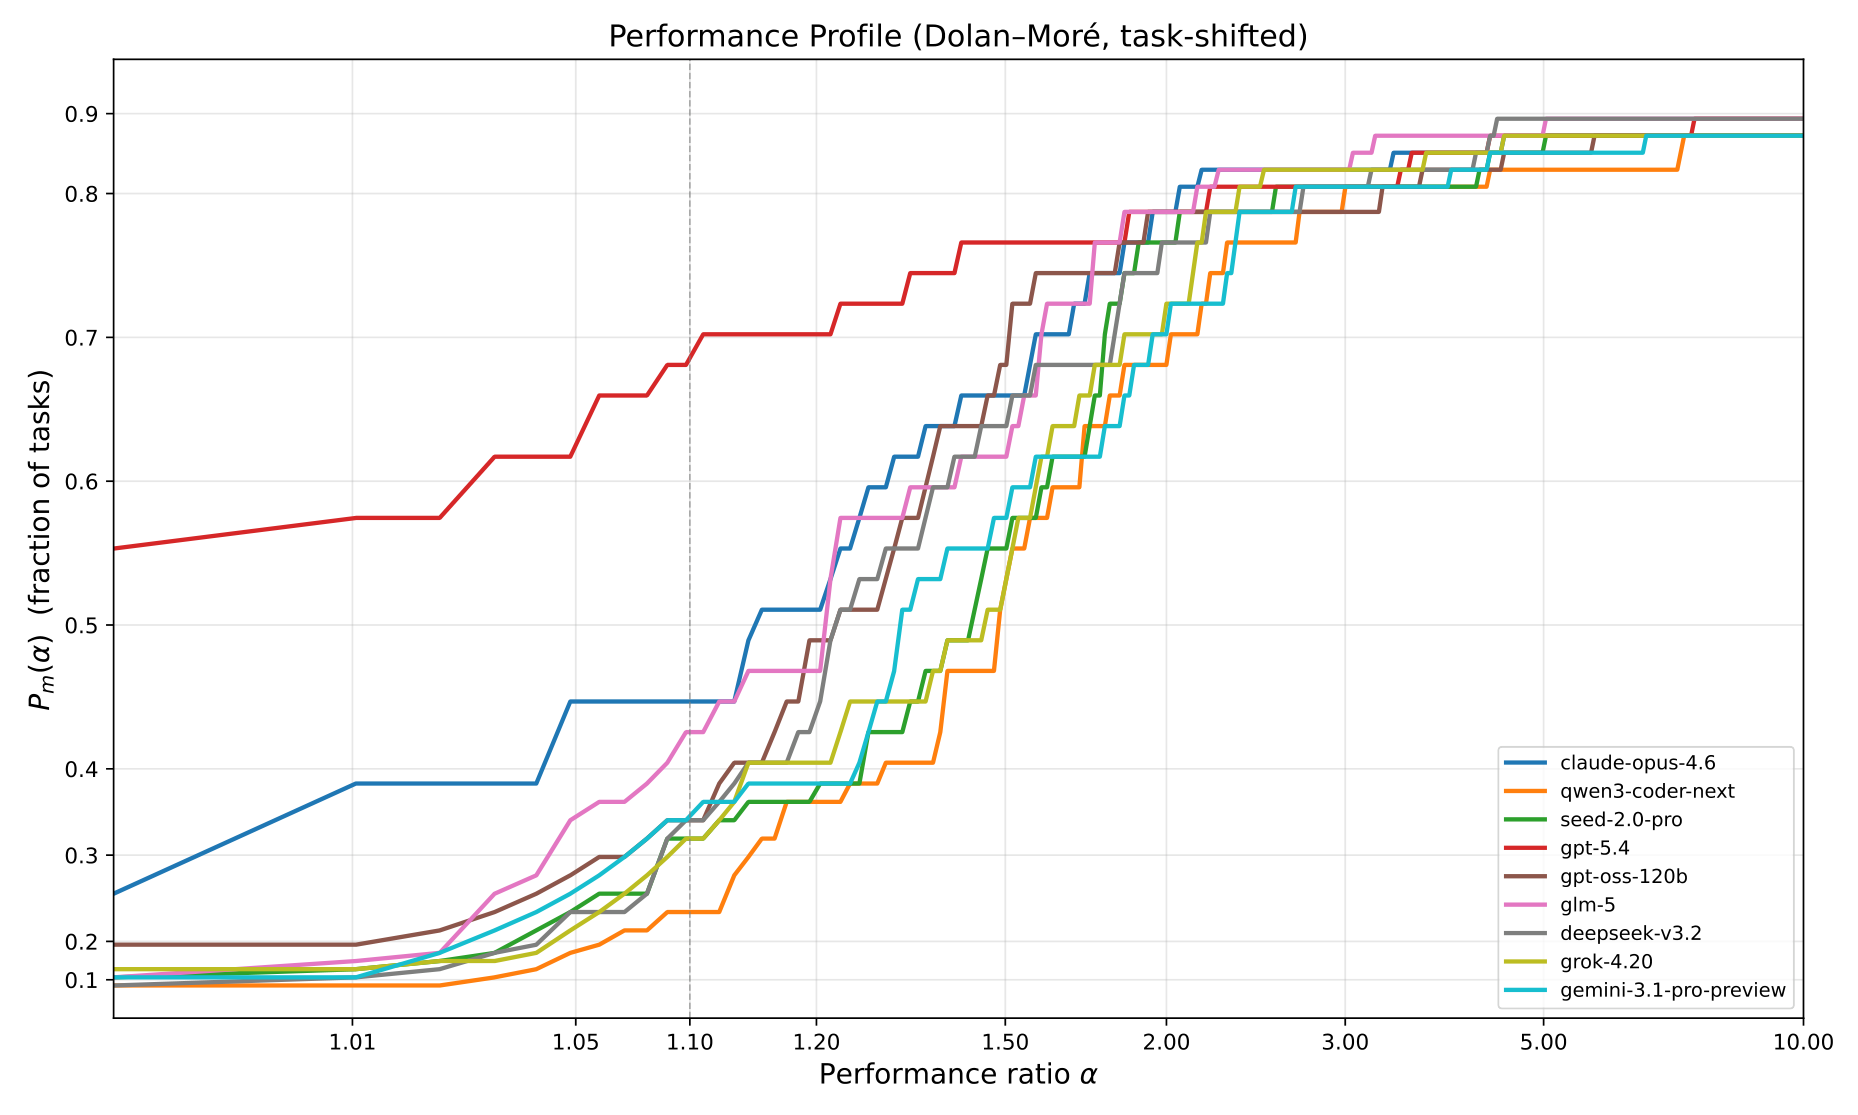
Performance profile
A Dolan–Moré performance profile: each curve shows how often a model stays near the best score on the bench within a given slack. Higher on the left means stronger and more consistent across the 47 tasks.
Browse the benchmark task by task → open Tasks